Chart Recorders
A chart recorder is a device that's able to record an electrical or mechanical trends onto a rolling piece of paper. Chart recorders can record a number of inputs, it does this through different coloured pens that can work simultaneously on strip charts or circular charts.
There are three types of chart recorders from mechanical, electrical to electro-mechanical. The most common type of recorders are electro-mechanical as they use a combination of mechanical and electronic elements to produce a graph by using pens. However there are more modern chart recorders that are solely electronic operated. The advantage of using an electronic chart recorder is that the data can be transferred to a computer and be stored for later analysis or to be compared to.
A chart recorder can record a number of processes and electrical signals. Traditionally chart recorders record the data on a roll of paper, for example at a wood merchant, they can use a chart recorder to measure the level of moisture in drying wood in an easy to read chart. It works as the paper passes through the coloured pen is then deflected to signify the proportion of the measurement. This can then be easily read on a graph which displays all of the data. As we've mentioned before charts can be put together with a single pen or through multi-coloured pens.
Types of Chart Recorders
- Strip Chart Recorders – these consist of a roll of paper that is passed through a pen or multiple pens to mimic the signals received from the measurement also known as paper chart recorders. They are popular in laboratories and process measurement applications, suited for recording continuous processes.
- Circular Chart Recorders – Similar to strip chart recorders but they record the data in a circular motion. It makes them ideal for batch processing.
- Hybrid Recorders – These of the functionality of a chart recorder and a data data logger.
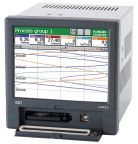
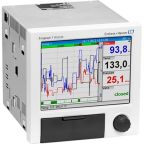
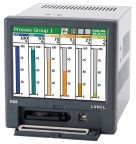
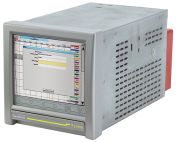
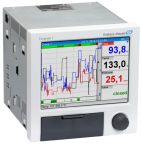
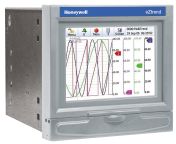
- Paperless Recorders – these are electronic chart recorders that can gather the graphs digitally then can be transferred to a computer for storage or analysis.
Where would you use a chart recorder?
Chart recorders can be found in manufacturing plants, where they track such variables as:
- Temperature
- Pressure
- Flow
- pH
- Humidity
- Diagnostics
- Statistical analysis


Popular Searches
Related links
- 431879 Software for use with Chart Recorders
- Jumo 431882 Software for use with Chart Recorders
- Chart Recorder Accessories
- Lumel KD7 7 Videographic Chart Recorder Thermocouple
- ABB SM50DCF 4-Channel Videographic Chart Recorder Current Temperature, Voltage
- ABB SM503FCB 4-Channel Videographic Chart Recorder Current Temperature, Voltage
- ABB C1911 1-Channel Circular Chart Recorder Current Resistance Voltage
- Eurotherm 3 Graphical Graphic Recorder Millivolt Voltage Temperature